Debugging
Additional debugging tools are available in this project, such as:
- Visualisation of widget painting by using a random background fill colour when a widget is painted
- EPILEPSY WARNING - This creates blocks of randomly flashing colours for widgets that update frequently
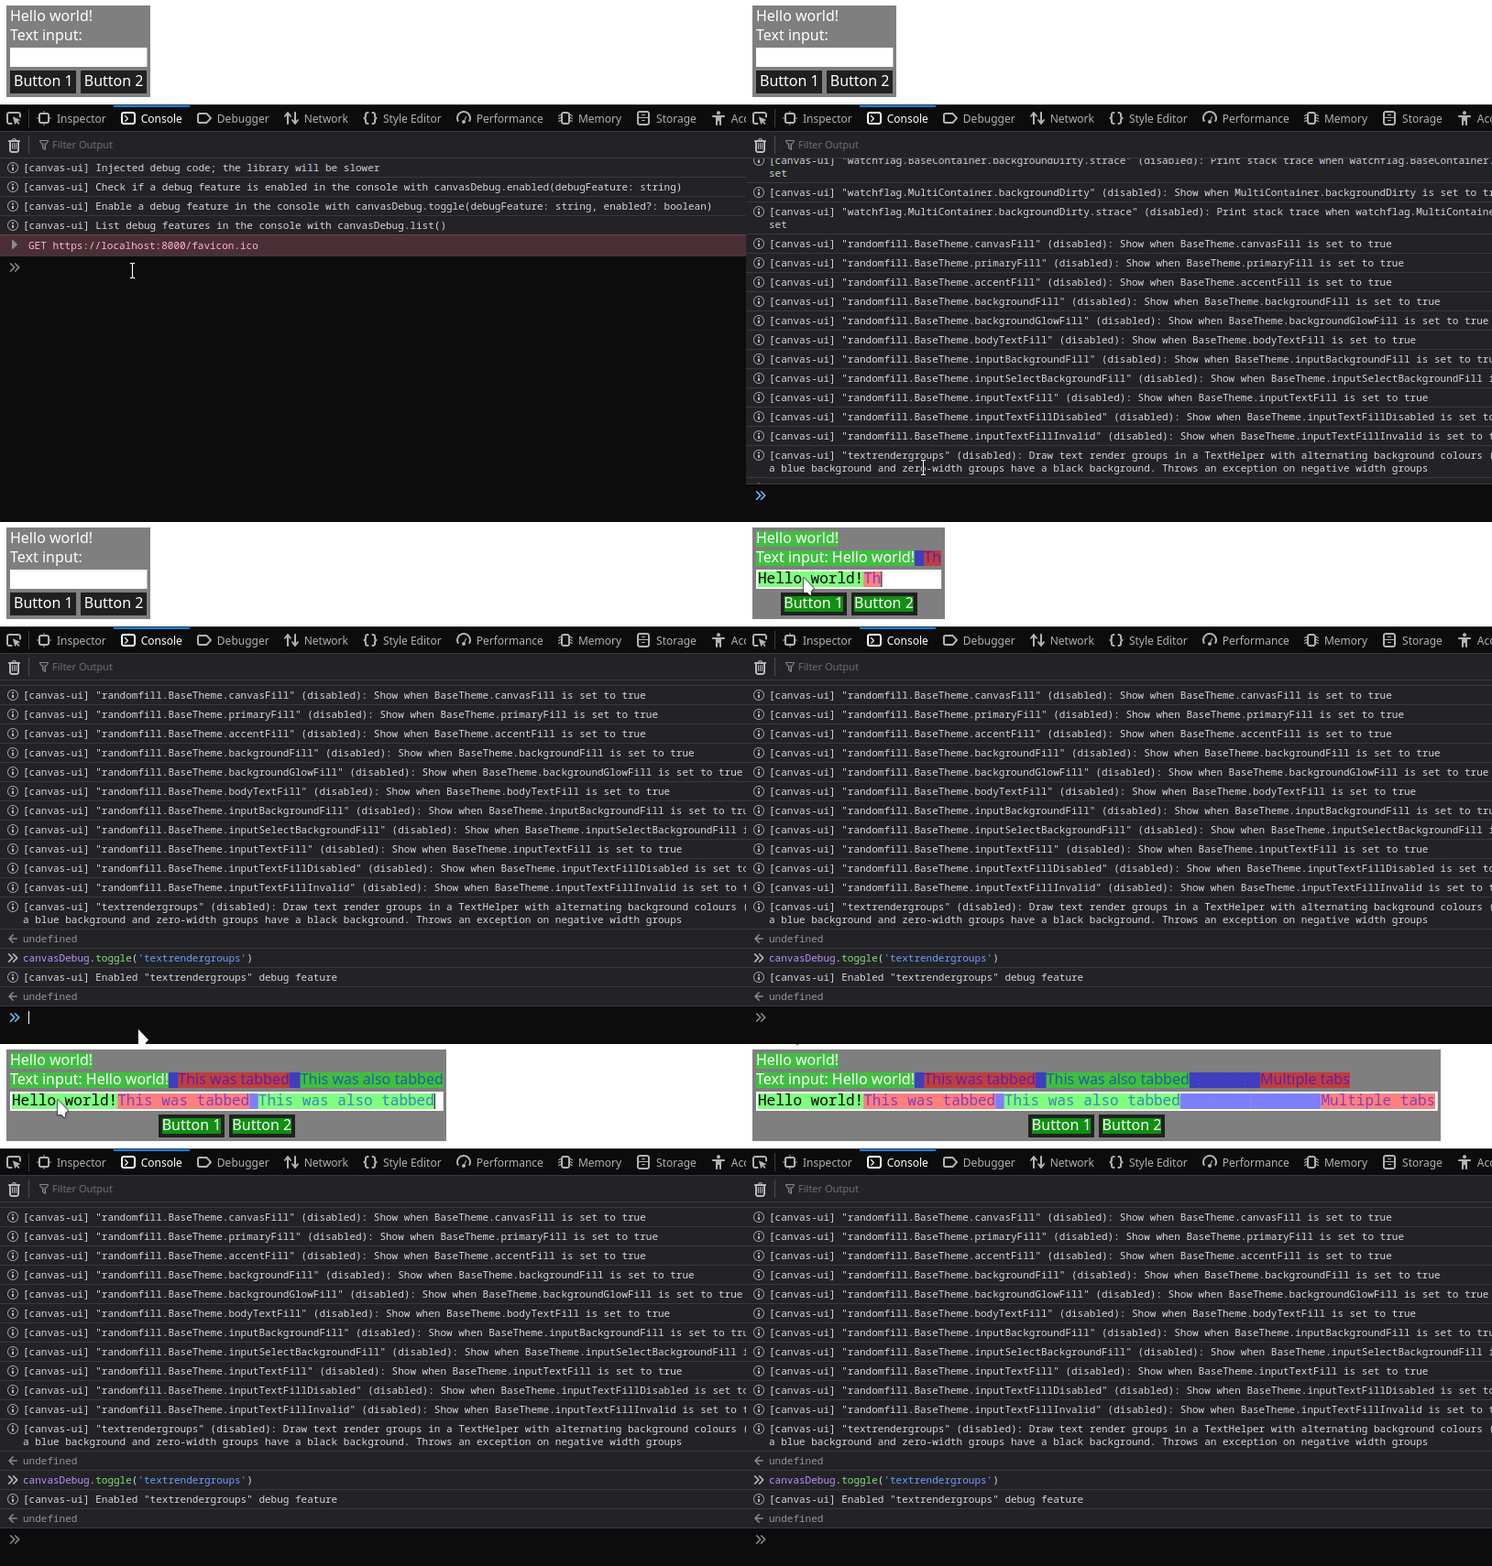
- Visualisation of text render groups to debug text wrapping issues
- Tracing recursive method calls, such as the
dispatchEventmethod - Watching when flags are set, such as the
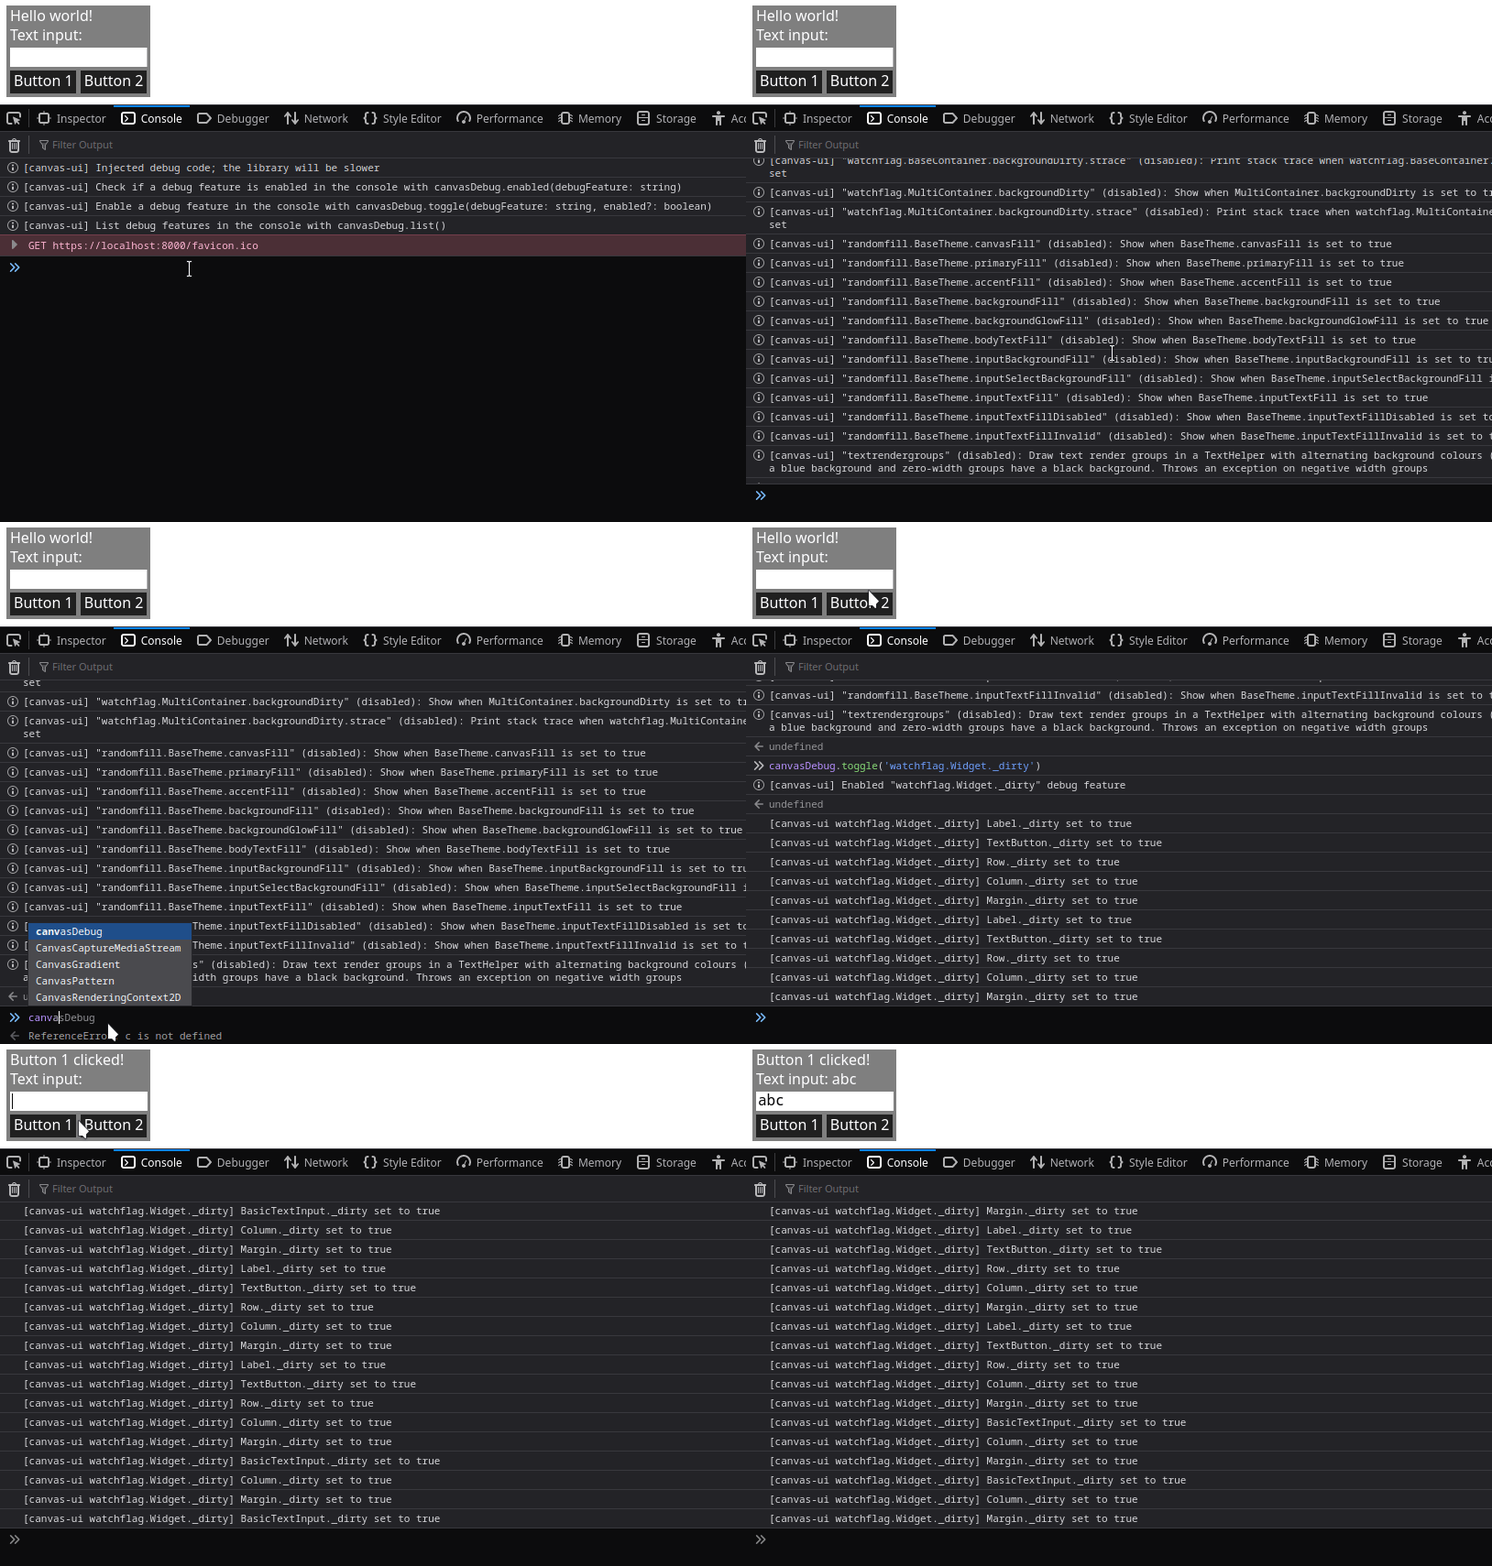
_dirtyor_layoutDirtyflags - Printing a grouped stack trace to the console when a specific method is called
Demonstration of the textrendergroups debug feature

Demonstration of the watchflag debug feature

Each of these features is identified by a name and can be individually toggled and queried to check if they are enabled. All of the available features, called debug features, can also be listed.
These features create additional overhead, even when disabled. Because of this,
the debugging tools are implemented as wrappers for method calls, and are
injected at runtime when needed. The wrappers can be injected by calling the
injectDebugCode function, which must first be imported. When the code is
injected, a new global object (canvasDebug) is available in the console and a
help message is printed to the console. This object has the following functions:
canvasDebug.list(): Print a list of all of the available debug featurescanvasDebug.toggle(debugFeature, enable): Toggle a debug feature identified by thedebugFeatureargument.enabledis an optional boolean argument; if set, then the feature is enabled or disabled depending on whether the argument istrueorfalse, but if not set, then the feature is toggledcanvasDebug.enabled(debugFeature): Check whether a debug feature identified by thedebugFeatureargument is enabled. Returns true if enabled, false if not
These 3 functions can also be imported via the listDebugFeatures,
toggleDebugFeature and isDebugFeatureEnabled functions, but
injectDebugCode must still be called before using these functions.